Work and Torque (Solution)

THIS IS A REDUNDANT POST 😀  AND THE ORIGINAL POST IN MY Quantity System Blog

http://quantitysystem.wordpress.com/2010/04/15/work-and-torque-solution/

———————–

I am really sorry

I didn’t notice that I haven’t posted how did I solve the dilemma of Torque and Work Problem

however the solution was there in my discussion of quantity System http://quantitysystem.codeplex.com/Thread/View.aspx?ThreadId=23672

and also on this post of my personal blog  http://blog.lostparticles.net/?p=28

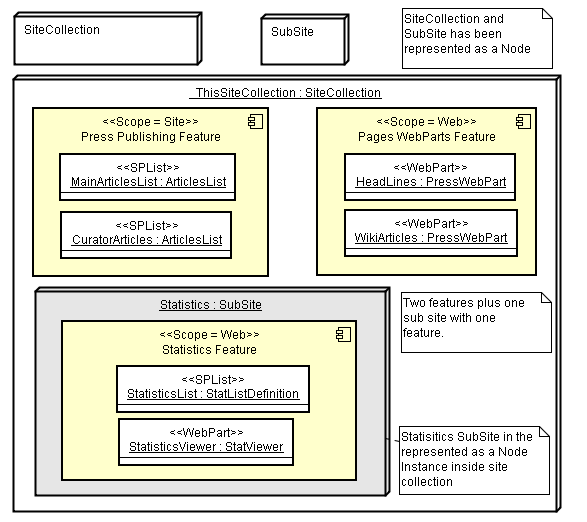
Problem Core: Length

Simply I defined TWO Length Types

Normal Length (NL)

This is the normal length that we refer to it in our daily life

Radial Length (RL)

This is the radius length that have an origin point in center of circle

Quantities

Work:       Force * Normal Length

Torque:   Force * Radial Length

Angle:      Normal Length / Radial Length

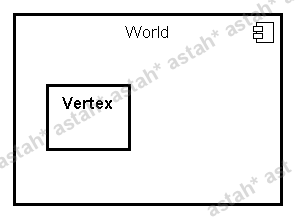
In quantity system I made the L dimension as NL+RL

CAN YOU SEE ANGLE

I made it explicitly a quantity that is NOT dimensionless

and THIS SOLVED ALL my problems of this Problem

I won’t argue much let us test 🙂

Torque * Angle = Work

F*RL * (NL/RL) =  F * NL    <== see what I mean

Torque * Angular Speed = Power

F*RL * (NL/RL*T) = F*NL/T   <== where T is the time.

so you may wonder about Angle and Solid Angle

in SI they are all dimensionless  but in Quantity System YOU CAN’T consider them like this

(By the way I’ve break the checking for these two quantities to be summable with dimensionless numbers – just to keep the fundamentals as it is although I am not convinced and I may remove it in future but damn it I need support from any physics guy)

ANGLE :  NL/RL

Solid Angle:  NL^2/RL^2   because its area over area

Frequency =  1/T

Angular Velocity = (NL/RL)/T

do you remember the conversion between RPM to frequency

RPM (Revolution Per Minute) is a Angle / Time

lets test the law

Omega  = 2*pi*frequency

pi: radian value which is  NL/RL

Omega = (NL/RL) * 1/T = (NL/RL)/T   which  angular velocity

Discoveries

PI value

PI is ratio of any circle‘s circumference to its diameter    WHICH MEANS  (NL/RL)

this is the same value as the ratio of a circle’s area to the square of its radius     WHICH MEANS  (NL^2/RL^2)

which corresponds to radian unit and stradian unit for angle and solid angle quantities.

Reynolds Number

I am not holding back ( Reynolds number is a dimensionless number that measure inertial forces to viscous forces)

WHY we always differentiating between Flow in Pipes and Flow on Flat plate

let’s see with normal length in quantity system

Qs> rho = 3[Density]
Density: 3 <kg/m^3>
Qs> v=0.5<m/s>
Speed: 0.5 <m/s>
Qs> l=4<m>
Length: 4 m
Qs> mue = 2<Pa.s>
Viscosity: 2 <Pa.s>
Qs> rho*v*l/mue
DimensionlessQuantity: 3 <kg/m.s^2.Pa>

it shows it is a dimensionless quantity

ok let us force my theory about flow in pipes

the pipe have a diameter  and Reynolds number is calculated by rho*v*DIAMETER/viscosity

so let me add d as a diameter and solve again

Qs> d=0.5<m!>

RadiusLength: 0.5 m

Qs> rho*v*d/mue

DerivedQuantity: 0.375 <kg/m.s^2.Pa>

NOTE: Adding ‘!’ after the length unit will mark the quantity as Radial Length quantity.

ERROR  it shouldn’t be DerivedQuantity at all it should be Dimensionlesss

so there is another term that should be fixed. Do you know which term ???

lets try the velocity  with vr=0.5<m!/s>

Qs> vr=0.5<m!/s>

DerivedQuantity: 0.5 <m/s>

Qs> rho*vr*d/mue

DerivedQuantity: 0.375 <kg/m.s^2.Pa>

ALSO ERROR

ok let us try the density

Qs> rhor = 3<kg/m!^3>

DerivedQuantity: 3 <kg/m^3>

Qs> rhor*v*d/mue

SolidAngle: 0.375 <kg/m.s^2.Pa>

CAN YOU SEE THE SOLID ANGLE Quantity

do you remember the above argue about Solid Angle is dimensionless number

can I pretend now that reynolds number for pipes is CORRECT ???

the new density which is kg/m!^3

This is driving me nuts

Pump Affinity Laws

Also  pump equations led to the same SolidAngle Quantity not DimensionLess one

Epilogue

I’ve said what I’ve discovered till now about this problem I hope that may be someday someone explain to me or convince me that Angle is really a Dimensionless number   after all of this and that my assumption about Torque and Work is Wrong.

Qs> rho = 3[Density]Density: 3 <kg/m^3>Qs> v=0.5<m/s>Speed: 0.5 <m/s>Qs> l=4<m>Length: 4 mQs> mue = 2<Pa.s>Viscosity: 2 <Pa.s>Qs> rho*v*l/mueDimensionlessQuantity: 3 <kg/m.s^2.Pa>

Entropy and Entropy Generation in Daily Life

The following paragraph from the “Thermodynamic An Engineering Approach” 5th Editiond [Yunus A. Cengel, and Micheal A. Boles]

The concept of entropy can also be applied to other areas. Entropy can be viewed as a measure of disorder or disorganization in a system. Likewise, entropy generation can be viewed as a measure of disorder or disorganization generated during a process. The concept of entropy is not used in daily life nearly as extensively as the concept of energy, even though entropy is readily applicable to various aspects of daily life. The extension of the entropy concept to nontechnical fields is not a novel idea. It has been the topic of several articles, and even some books. Next we present several ordinary events and show their relevance to the concept of entropy and entropy

generation.

Efficient people lead low-entropy (highly organized) lives. They have a place for everything (minimum uncertainty), and it takes minimum energy for them to locate something. Inefficient people, on the other hand, are disorganized and lead high-entropy lives. It takes them minutes (if not hours) to find something they need, and they are likely to create a bigger disorder as they are searching since they will probably conduct the search in a disorganized manner (Fig. 7–26).

People leading high-entropy lifestyles are always on the run, and never seem to catch up.

You probably noticed (with frustration) that some people seem to learn fast and remember well what they learn. We can call this type of learning organized or low-entropy learning. These people make a conscientious effort to file the new information properly by relating it to their existing knowledge base and creating a solid information network in their minds.

On the other hand, people who throw the information into their minds as they study, with no effort to secure it, may think they are learning. They are bound to discover otherwise when they need to locate the information, for example, during a test. It is not easy to retrieve information from a database that is, in a sense, in the gas phase. Students who have blackouts during

tests should reexamine their study habits.

A library with a good shelving and indexing system can be viewed as a lowentropy library because of the high level of organization. Likewise, a library with a poor shelving and indexing system can be viewed as a high-entropy library because of the high level of disorganization. A library with no indexing system is like no library, since a book is of no value if it cannot be found.

Consider two identical buildings, each containing one million books. In the first building, the books are piled on top of each other, whereas in the second building they are highly organized, shelved, and indexed for easy reference.

There is no doubt about which building a student will prefer to go to for checking out a certain book. Yet, some may argue from the first-law point of view that these two buildings are equivalent since the mass and knowledge content of the two buildings are identical, despite the high level of disorganization (entropy) in the first building.

This example illustrates that any realistic comparisons should involve the second-law point of view.

Two textbooks that seem to be identical because both cover basically the same topics and present the same information may actually be very different depending on how they cover the topics. After all, two seemingly identical cars are not so identical if one goes only half as many miles as the other one on the same amount of fuel. Likewise, two seemingly identical books are not so identical if it takes twice as long to learn a topic from one of them as it does from the other. Thus, comparisons made on the basis of the first law only may be highly misleading.

Having a disorganized (high-entropy) army is like having no army at all. It is no coincidence that the command centers of any armed forces are among the primary targets during a war. One army that consists of 10 divisions is 10 times more powerful than 10 armies each consisting of a single

division. Likewise, one country that consists of 10 states is more powerful than 10 countries, each consisting of a single state. The United States would not be such a powerful country if there were 50 independent countries in its place instead of a single country with 50 states. The European Union has the potential to be a new economic and political superpower.

The old cliché “divide and conquer” can be rephrased as “increase the entropy and conquer.”

We know that mechanical friction is always accompanied by entropy generation, and thus reduced performance. We can generalize this to daily life: friction in the workplace with fellow workers is bound to generate entropy, and thus adversely affect performance (Fig. 7–27). It results in reduced productivity.

We also know that unrestrained expansion (or explosion) and uncontrolled electron exchange (chemical reactions) generate entropy and are highly irreversible. Likewise, unrestrained opening of the mouth to scatter angry words is highly irreversible since this generates entropy, and it can cause considerable damage. A person who gets up in anger is bound to sit down at a loss.

Hopefully, someday we will be able to come up with some procedures to quantify entropy generated during nontechnical activities, and maybe even pinpoint its primary sources and magnitude.

Provisioning Modeling in SharePoint

Abstract

A new modeling technique for SharePoint using standard UML diagrams. The technique will be addressed as an architect tool for SharePoint during implementation and deployment of SharePoint Applications.

Introduction

Microsoft SharePoint is a server product targeted for the collaboration between business owners, researchers, and employees. Its target is to clearly help the organization structure, documents, and process flow to be shared into one organized location.

This location is then managed and moderated by a group of selected users in the firm that strictly speaking (the ones who are aware of the business requirements to the organization)

This article will discuss a modeling technique for SharePoint Applications (developed during the work with SharePoint 2007).

Although the article will give a decent definitions of SharePoint concepts, but a little experience of SharePoint will be helpful to continue reading this Article.

SharePoint Provisioning Containers

Figure 1: Typical SharePoint hierarchy Relation

Farm

The SharePoint farm is the biggest conceptual entity in the SharePoint hierarchy model. Farm is the container to all web servers, and sql servers that synchronize the content between all of resources together.

Web Application

The SharePoint web application (Encapsulated in SPWebApplication) is a direct representation to the port number beside the http address protocol for example (http://HeavyPoint:5000).

When you create a web application you actually should keep the following items in mind:

  • Application Database.
  • Application Security.
  • Sub Web applications that help in interfacing for
    • Internet
    • Extranet
    • Intranet
  • Application Configurations (web.config)

Site Collection

The second conceptual entity under SharePoint is the Site Collection.

Site collection is the entry point for development under SharePoint.

By creating site collection please keep in mind:

  • Sub Sites Container
  • Global Features (Per Site Collection)
  • Variation Root. (This is the multi-cultural support under SharePoint.)

Sub site

The minimum conceptual container of SharePoint and the exit point for development. Sub sites has the same anatomy of Site Collection however they have their private settings that is not shared among other sites also they inherit their site collection parent settings.

UML (Unified Modeling Language) Diagrams

UML introduced to us a lot of diagrams that theoretically can be used to describe any software architecture. The special stereo type of UML is the key point of describing the SharePoint Provisioning.

Therefore we are going to introduce the important diagrams that we are using in this article (I’ll assume that the reader does know the class diagram, so I will not mention its usage here)

Component Diagram

Figure 2: Component Diagram with one Component.

The Component diagram is a container for a lot of other UML entities. Figure 2 illustrate a component called World have inside it a Vertex class.

Components actually in my opinion don’t have a specific 1 to 1 scenario to describe its usage. However we can describe the component by characteristics as:

  • The minimum executable entity that can be plugged in and out to the application.
  • Standalone object modules.
  • Hold a complete implementation to specific functionality.
  • Can’t be used independently out of the host application.

From these characteristics Components concept can be expanded to hold component in component mechanism. A sample of components is DirectX, Servlets, ActiveX, and Flash Objects.

Deployment Diagram

The deployment diagram is a valuable diagram to describe where a specific thing will be put (provisioned)??

The deployment diagram is a collection of physical or nearly physical locations that can be stated, categorized and documented.

SharePoint Definition vs. Provision

The difference between Definition and Provision in SharePoint is the same as the difference between declaring a class and using objects of these classes in the programming language.

Samples of definitions are

  • List Definition
  • WebPart Definition
  • Content Types
  • Site Columns
  • Site Definition
  • Workflow Definition

Provisioning in SharePoint is the Process of putting SharePoint Definitions into their appropriate containers in SharePoint. And the center entity that contains all definitions together is the SharePoint Features.

SharePoint Feature

SharePoint Feature is the minimum deployable entity that can be enabled on the site or sub site level. The Feature contains schemas of definitions.

When you enable a feature over a site it takes all the schemas inside it and tries to put it inside the site or the site collection. Features include any selected numbers of List definitions, web parts, and workflows.

Features has a receivers that perform specific behavior while installation and activation

Features have 4 specific operations:

  • Installation         (Transfer the Feature Files from File System into the content database)
  • Activation         (The Feature is provisioning its contents into the site that it was activated into, and execute the receiver activation code)
  • Deactivation         (opposite of activation)
  • Uninstallation         (Remove the Feature Files from the Database)

Provisioning Modeling

Now after we’ve reviewed SharePoint Concepts and the Required UML Diagrams we can jump into the modeling technique itself.

As we mentioned before the SharePoint Feature is the main entity that control the provisioning, so it is certainly the most suitable to choose as a starting point of our solution.

Table 1: Representation of SharePoint Entities in UML

SharePoint Definition UML Representation Stereo Type
List Definition Class Shape <<SPList>>
List Provisioning Object Shape
WebPart Class Shape <<WebPart>>
Site Column Class Shape <<SPSiteColumn>>

<<Type=”Image, Text, or etc.>>

Content Type Class Shape <<SPContentType>>
Feature Component Shape <<Scope=Site, Web, or Farm>>

And by employing the UML diagram rules to the relations between types (association, and aggregation) we can form a relation between Content Type and List Object or Site Column and Content Type or List Definition

UML Representation Example

Let us assume that we have a List hold two Content Types and one site column, one of the content types depend on other site columns.

NOTE: Lists in SharePoint may have multiple Content Types (like publishing feature with Pages List)

Component Diagram

First we draw a component diagram for the feature that tells us “What in the feature?”

Figure 3: Feature as a Component

The diagram actually tells us a lot of information about the feature called “Press Publishing Feature”. It tells us that there is list definition called ArticlesList with two content types Press Page, and Critic Page.

Also the custom Site Columns that we’ve created are actually appearing in the component diagram which increases the illustrative aim of the diagram.

With this simple representation to the feature content, we can now leverage the potential of this technique in modularizing our SharePoint features and their contents

However we still lake very important information!! Where all of these contents will go when we activate this feature?? The answer simply lies in the next lines.

Feature Activation (Deployment Diagram)

Every feature in SharePoint has a time of activation. When we activate the feature it takes its contents from the content database and read the xml files inside it and begin to distribute its contents based on the developer will.

This can be illustrated with the following UML deployment diagram

Figure 4: Deployment of Features

The diagram really describes the provisioning schema of the features of this Sample SharePoint Application.

We can see clearly that there are a SiteCollection “_ThisSiteCollection” with Two Features

  • Press Publishing Feature
  • Pages WebParts Feature

Also a subsite called “Statistics” which has another feature activated in it “Statistics Feature”

In the Statistics Feature Note that we put two instances shapes that represent what will the feature provision when activate.

In order

  • Press Publishing Feature Provision
    • MainArticlesList of the list definition ArticlesList
    • CuratorArticles of the list definition ArticlesList
  • Pages WebParts Feature Provision two webparts with the same definition
    • HeadLines
    • WikiArticles
  • Statistics Feature Provision
    • StatisticsList of the list definition StatListDefition
    • StatisticsViewer of StatViewer WebPart definition

Summing all concepts together we can state clearly that every Feature should have two diagrams

  • Component Diagram: responsible of describing “WHAT IN THIS FEATURE??”
  • Deployment Diagram: responsible of describing “WHERE TO PUT ITS CONTETNS??”

Conclusion

By answering the two questions of Feature (What and Where). We feel confident about our approach in describing the intent of feature among features inside custom SharePoint Application.

As SharePoint product now is entering its 2010 version, organizations are ready for more adoption to this technology. However the lake of a clear modeling of what is required to build a successful SharePoint application that Business Owners, Developers, and Decision makers can sense and measure its usefulness, increase the barrier of using SharePoint in the right direction.

By introducing a modeling technique based on standard UML notation, we think that this step will leverage more potential of SharePoint and its usage.

Also this technique encourages the description by business perspective more than development perspective which can be positioned as a middle representation for all parties involved in SharePoint development.

By this contribution to the SharePoint community we wish to see more complex scenarios that simplified by this technique and to help developers to think about architecture before webpart implementation. Also to encourage the complete views for solutions not partial views that always lake the illustrative understanding of the desired functionality.

Second-Generation Nanotechnology

Despite its versatility, protein has shortcomings as an engineering material. Protein machines quit when dried, freeze when chilled, and cook when heated. We do not build machines of flesh, hair, and gelatin; over the centuries, we have learned to use our hands of flesh and plastic. We will do likewise in the future. We will use protein machines to build nanomachines of tougher stuff than protein. 

As nanotechnology moves beyond reliance on proteins, it will grow more ordinary from an engineer’s point of view. Molecules will be assembled like the components of an erector set, and well-bonded parts will stay put. Just as ordinary tools can build ordinary machines from parts, so molecular tools will bond molecules together to make tiny gears, motors, levers, and casings, and assemble them to make complex machines. 

Parts containing only a few atoms will be lumpy, but engineers can work with lumpy parts if they have smooth bearings to support them. Conveniently enough, some bonds between atoms make fine bearings; a part can be mounted by means of a single chemical bond that will let it turn freely and smoothly. Since a bearing can be made using only two atoms (and since moving parts need have only a few atoms), nanomachines can indeed have mechanical components of molecular size. 

How will these better machines be built? Over the years, engineers have used technology to improve technology. They have used metal tools to shape metal into better tools, and computers to design and program better computers. They will likewise use protein nanomachines to build better nanomachines. Enzymes show the way: they assemble large molecules by “grabbing” small molecules from the water around them, then holding them together so that a bond forms. Enzymes assemble DNA, RNA, proteins, fats, hormones, and chlorophyll in this way — indeed, virtually the whole range of molecules found in living things. 

Biochemical engineers, then, will construct new enzymes to assemble new patterns of atoms. For example, they might make an enzyme-like machine which will add carbon atoms to a small spot, layer on layer. If bonded correctly, the atoms will build up to form a fine, flexible diamond fiber having over fifty times as much strength as the same weight of aluminum. Aerospace companies will line up to buy such fibers by the ton to make advanced composites. (This shows one small reason why military competition will drive molecular technology forward, as it has driven so many fields in the past.) 

By KEVIN ULMER Director of Exploratory Research
Genex Corporation

Engines of Creation 2.0 

Technology Cocktail

Hello and Welcome to the technology cocktail blog.

In this blog, we will not concentrate on a specific subject. However we will try to concentrate our thinking and our effort to the complete views of science, and engineering aspects that when integrating together gives us the complete recipe of technology.

The blog ideology will be anti-separation of subjects it deals with.

Moreover we will try as much as we can to track the possibilities of deconstructing and constructing the subject in concern, so that we end up with a new explaining model that is informative and illustrative in its content on the inside and outside level.

For the sake of this aim, this blog will not be a demonstration of the strong skills of its writers, but will be a guide to the best solution the writers think about based on their expertise and their  point of view.

So you may ask, what will this blog really about ?!!.

Speaking on my self I will blog on Mechanical Engineering, Software Engineering, and Music Engineering. Also I will share news, thoughts, and my thoughts about it.

but I really wish to have others that share with me the passion of complete views not partial views that their environment force them to align with.

I’ve refused to be known by my job title nor by my ideological directions. but as myself as a human being who has a complex feelings that is not tied to the market need, or to be another “Instrumental Reason Entity”.

In this blog we will bypass the partial technical problems into a complete view technical solutions.

But we will not deceive ourselves or the reader with FINAL SOLUTIONS.

I hope that I’ve demystified the reason of this blog (at least for me).

Thank you,